How to interpret the Dashboard
Last updated: November 3, 2026
The Dashboard is the first screen you see when you log in to the Strike platform. It summarizes your organization's security status in one place: how many open vulnerabilities you have and how severe they are, how your exposure evolves month over month, which assets concentrate the most risk, what Strike is running right now, and how much of your plan you have used.
All the information is calculated from your organization's real data and updates automatically. Each card shows when it was last updated.
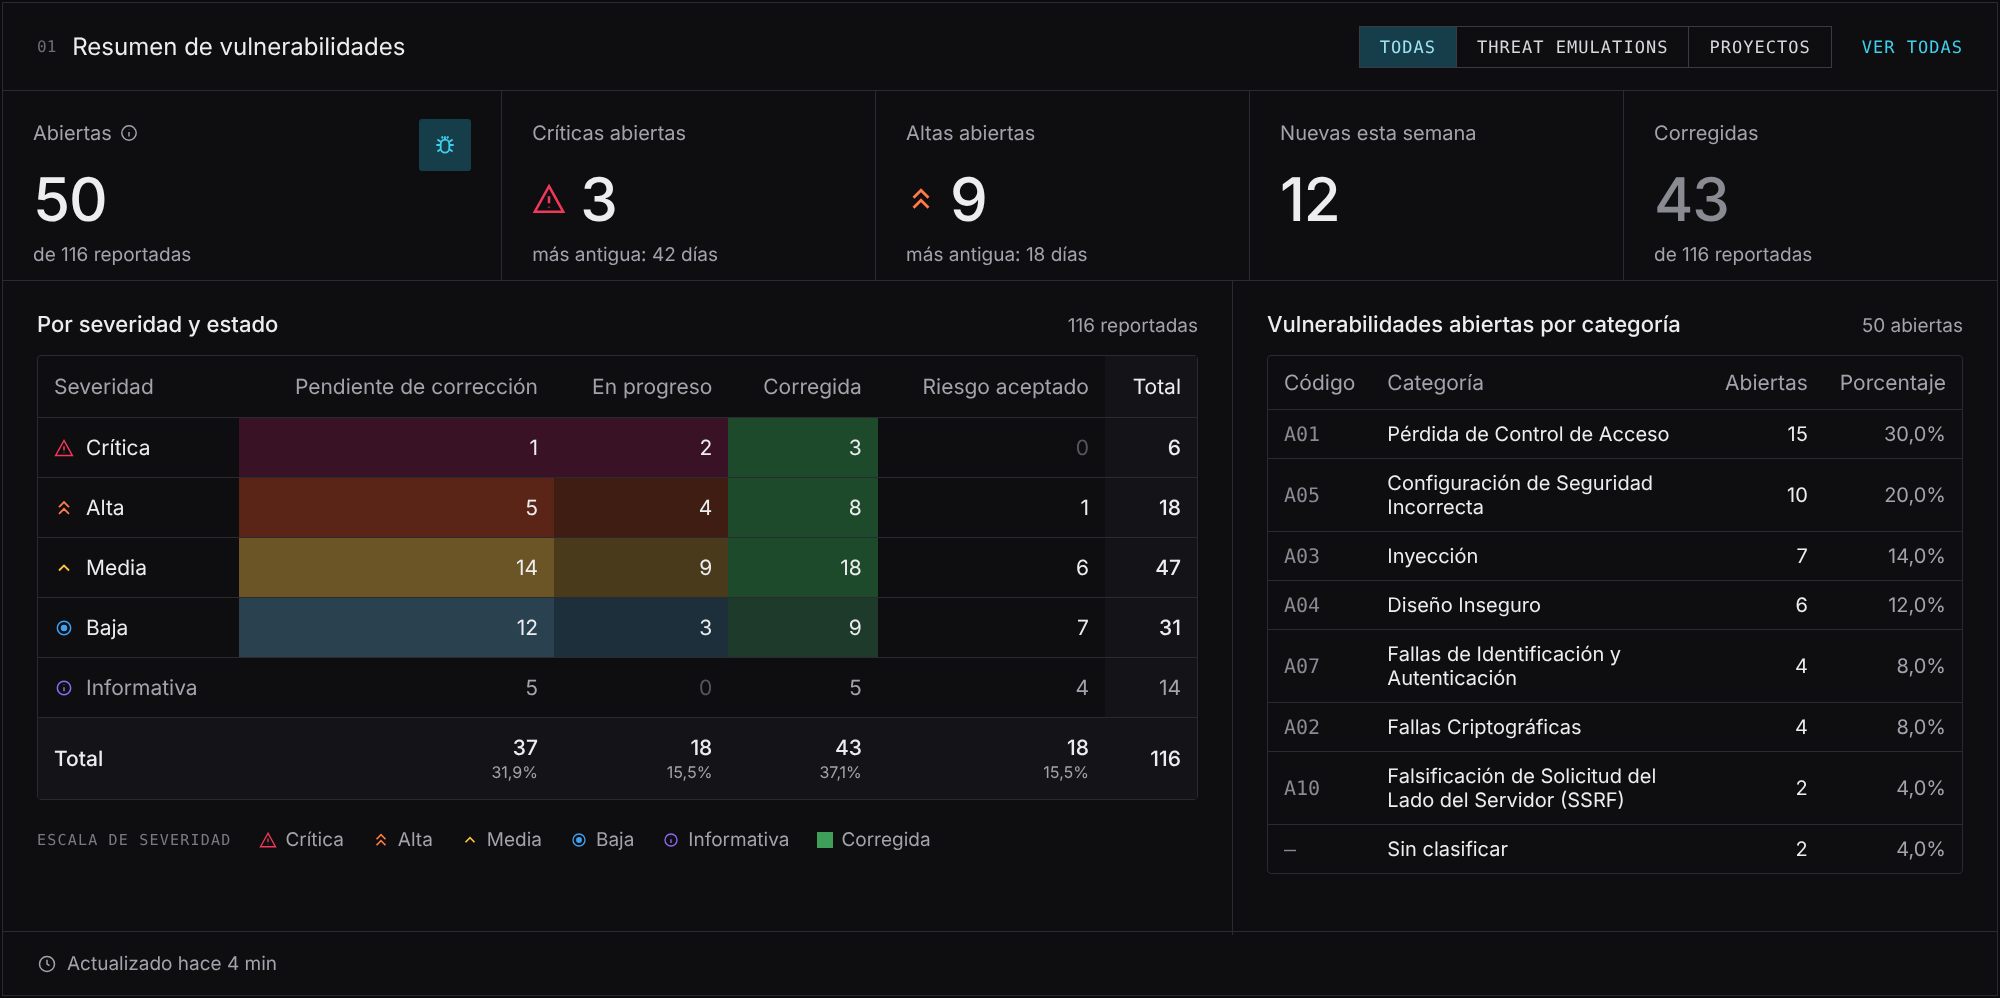
What you will find on the Dashboard
The Dashboard is organized into cards, each focused on a specific question:
Vulnerability summary: your open vulnerabilities, with a breakdown of how many are critical and high, how many were reported this week, and how many have already been fixed. It includes a severity-by-status matrix (Pending Fix, In progress, Fixed, and accepted risk) and a breakdown of open vulnerabilities by OWASP Top 10 category, so you can identify the domains with the highest occurrence. You can filter this summary to see only what was reported in Threat emulations or in Projects.
Exposure over time: how many open vulnerabilities you had at the end of each month and how many were fixed during that period. You can choose the time range (30 days, 90 days, 6 months, 12 months, or the full history).
Highest-risk assets: the assets with the most open vulnerabilities, their severity, the relevance you assigned to each asset, and when it was last tested.
Threat emulations: the status of each threat emulation, its last and next execution, and the total number of open vulnerabilities for each one.
Recent activity: the latest updates in your organization, such as newly reported vulnerabilities, status changes, completed retests, and executions that have started.
Projects: the status of your projects and the number of vulnerabilities associated with each one.
Plan usage: the credits used out of the credits contracted, the projection at the end of the period, and its end date.
From each card, you can access the full detail with the View all button, which takes you to the corresponding section of the platform.
Keep your results up to date
The Dashboard data reflects the last time Strike tested your assets. If more than a month goes by without running a threat emulation, you will see a notice at the top of the Dashboard with a shortcut to create a new one. Running tests regularly is the way to make sure the Dashboard shows your real exposure and not an outdated snapshot.
Frequently asked questions
Why doesn't the total of open vulnerabilities match the total reported?
The Dashboard distinguishes between reported vulnerabilities (all the ones Strike found in the period) and open vulnerabilities (the ones that have not been fixed yet). Vulnerabilities in Fixed status count as reported but not as open.
Can I see the data for a single threat emulation or project?
The Dashboard shows the consolidated view of your entire organization. To analyze a specific threat emulation or project, access its detail from the corresponding section.
How often is the Dashboard updated?
The data updates automatically as Strike reports new vulnerabilities, statuses change, or executions are completed. Each card shows the time of its last update.